- collaboration
 Invite Team Members
- Assign Projects
- Users & Role Management
- Review Management [Test Cases]
- Review Management [Elements]
- Execution Controls
- Manage Test Cases
- Test Case List Actions
- Import and Export Test Cases
- Import Test Project Test Cases
- Importing Postman Collections and Environments
- Update Test Case result in a Test Plan
- Test Cases (Mobile Web App)
- Test Step Types
- Type: Natural Language
- Type: REST API
- Type: Step Group
- Type: For Loop
- Type: While Loop
- Type: Block
- Type: If Condition
- Nested Step Groups
- Image Injection
- Cross-application testing
- Test Data Types
- Raw
- Parameter
- Runtime
- Random
- Data Generator
- Phone Number
- Mail Box
- Environment
- Concat Test Data
- Create Test Data [Parameter]
- Update Test Data Profile
- Updating Value in TDP
- Import TDP
- Bulk Deletion of a Test Data Profile
- Create Test Data [Environment]
- Elements (Objects)
- Web Applications
- Record Single Element
- Record Multiple Elements
- Create Elements
- Supported Locator Types
- Formulating Elements
- Shadow DOM Elements
- Verifying elements in Chrome DevTools
- Handling iframe Elements?
- Dynamic Locators using Parameter
- Dynamic Locators using Runtime
- Using Environment Test Data for Dynamic Locators
- Locating Dynamic Elements in Date Widget
- Freeze & Inspect Dynamic Elements (WebPage)
- Locating Dynamic Elements in Tables
- Import/Export Elements
- AI Enabled Auto-Healing
- Locator Precedence (Web Apps)
- Verify Elements from Test Recorder
- test step recorder
- Install Chrome Extension
- Install Firefox Extension
- Install Edge Extension
- Exclude Attributes/Classes
- test plans
- Add, Edit, Delete Test Machines
- Add, Edit, Delete Test Suites
- Schedule Test Plans
- Run Test Suites In Parallel
- Cross Browser Testing
- Distributed Testing
- Headless Testing
- Test Lab Types
- Disabling Test Cases in Test Plans
- AfterTest Case
- Post Plan Hook
- AfterTest Suite
- Email Configuration in Test Plan
- Execute Partial Test Plans via API
- Ad-hoc Run
- Test Plan Executions
- Dry Runs on Local Devices
- Run Tests on Private Grid
- Run Tests on Vendor Platforms
- Run Test Plans on Local Devices
- Test Locally Hosted Applications
- Debug Test Case Failures
- Parallel and Allowed queues
- debugging
- Debug results on local devices (Web applications)
- Debug Results on Local Devices
- Launch Debugger in the Same Window
- Testsigma Agent
- Pre-requisites
- Setup: Windows, Mac, Linux
- Setup: Android Local Devices
- Setting up iOS Local Devices
- Update Agent Manually
- Update Drivers Manually
- Delete Corrupted Agent
- Delete Agents: Soft & Permanent
- Triggering Tests on Local Devices
- troubleshooting
- Agent - Startup and Registration Errors
- Agent Logs
- Upgrade Testsigma Agent Automatically
- Specify Max Sessions for Agents
- Testsigma Agent - FAQs
- continuous integration
- Test Plan Details
- REST API (Generic)
- Jenkins
- Azure DevOps
- AWS DevOps
- AWS Lambda
- Circle CI
- Bamboo CI
- Travis CI
- CodeShip CI
- Shell Script(Generic)
- Bitrise CI
- GitHub CICD
- Bitbucket CICD
- GitLab CI/CD
- desired capabilities
- Most Common Desired Capabilities
- Browser Console Debug Logs
- Geolocation Emulation
- Bypass Unsafe Download Prompt
- Geolocation for Chrome & Firefox
- Custom User Profile in Chrome
- Emulate Mobile Devices (Chrome)
- Add Chrome Extension
- Network Throttling
- Network Logs
- Biometric Authentication
- Enable App Resigning in iOS
- Enable Capturing Screenshots (Android & iOS)
- Configure Android WebViews
- Incognito/Private mode
- Set Google Play Store Credentials
- addons
- What is an Addon?
- Addons Community Marketplace
- Install Community Addon
- Prerequisites(Create/Update Addon)
- Create an Addon
- Update Addon
- Addon Types
- Create a Post Plan Hook add-on in Testsigma
- Create OCR Text Extraction Addon
- configuration
- API Keys
- Security(SSO)
- Setting Up Google Single Sign-On(SSO) Login in Testsigma
- Setting Up Okta Single Sign-On Integration with SAML Login in Testsigma
- Setting up SAML-based SSO login for Testsigma in Azure
- iOS Settings
- Creating WDA File for iOS App Testing
- uploads
- Upload Files
- Upload Android and iOS Apps
- How to generate mobile builds for Android/iOS applications?
- Testsigma REST APIs
- Environments
- Elements
- Test Plans
- Upload Files
- Get Project Wide Information
- Upload & Update Test Data Profile
- Fetch Test Results (All Levels)
- Trigger Multiple Test Plans
- Trigger Test Plans Remotely & Wait Until Completion
- Run the Same Test Plan Multiple Times in Parallel
- Schedule, Update & Delete a Test Plan Using API
- Update Test Case Results Using API
- Create and update values of Test Data Profile using REST API
- Rerun Test Cases from Run Results using API
- open source dev environment setup
- macOS and IntelliJ Community Edition
- macOS and IntelliJ Ultimate Edition
- Windows and IntelliJ Ultimate Edition
- Setup Dev Environment [Addons]
- NLPs
- Retrieve Value in Text Element
- Capture Dropdown Elements
- Unable to Select Radiobutton
- Unable to Click Checkbox
- Clearing the Session or Cookies
- UI Identifier NLP
- Drag & Drop NLP
- Uploading Files NLP
- setup
- Server Docker Deployment Errors
- Secured Business Application Support
- Troubleshooting Restricted Access to Testsigma
- Why mobile device not displayed in Testsigma Mobile Test Recorder?
- Unable to Create New Test Session
- Agent Startup Failure Due to Used Ports
- Tests Permanently Queued in Local Executions
- Fix Testsigma Agent Registration Failures
- Testsigma Agent Cleanup
- Need of Apache Tomcat for Testsigma Agent
- web apps
- URL not accessible
- Test Queued for a Long Time
- Issues with UI Identifiers
- Missing Elements in Recorder
- Collecting HAR File
- Errors with Browser Session
- Page Loading Issues
- mobile apps
- Failed to Start Mobile Test Recorder
- Troubleshooting “Failed to perform action Mobile Test Recorder” error
- Test Execution State is Queued for a Long Time
- Mobile app keeps stopping after successful launch
- More pre-requisite settings
- Unable to start WDA Process on iPhone
- Most Common causes for Click/Tap NLP failure
- Finding App Package & App Activity (Android)
- Cross-environment Compatible ID Locators (Android)
- Why Accessibility IDs Over other Locators?
- Common Android Issues & Proposed Solutions
- Finding the App Bundle ID for iOS
- on premise setup
- On-Premise Setup Prerequisites
- On-Premise Setup with Docker-compose File
- Post-Installation Checklist for On-Premise Setup
- Install Docker on an Unix OS in Azure Infrastructure
- SMTP Configuration in Testsigma
- Configure Custom Domains
- salesforce testing
- Intro: Testsigma for Salesforce Testing
- Creating a Connected App
- Creating a Salesforce Project
- Creating Metadata Connections
- Adding User Connections
- Build Test Cases: Manual+Live
- Salesforce Element Repositories
- Intro: Testsigma Special NLPs
- Error Handling On Metadata Refresh
- Automating Listview Table NLPs
- windows automation
- Intro: Windows Desktop Automation
- Windows (Adv) Project & Application
- Object Learning (Using UFT One)
- Converting TSR Files to TSRx
- Importing/Updating TSRx Files
- Test Cases for Windows Automation
- Error Handling Post TSRx File Update
Debug results on local devices (Web applications)
Debugging issues in complex test cases might require enhanced techniques. This article describes Testsigma's interactive debugging feature for web applications that will not only fix test step issues but also save a good amount of debugging time.
This feature is available in beta version only. Contact support for enabling the feature in your account.
Steps to execute test cases in debugger mode
-
Navigate to the test case you want to debug and interact with.
NOTE:If the test case uses a test data profile, users can choose only one data profile to use the debugging feature.
- On the test case details page, click the drop-down arrow beside the Run button.
- Select Run in debug mode from the drop-down list.
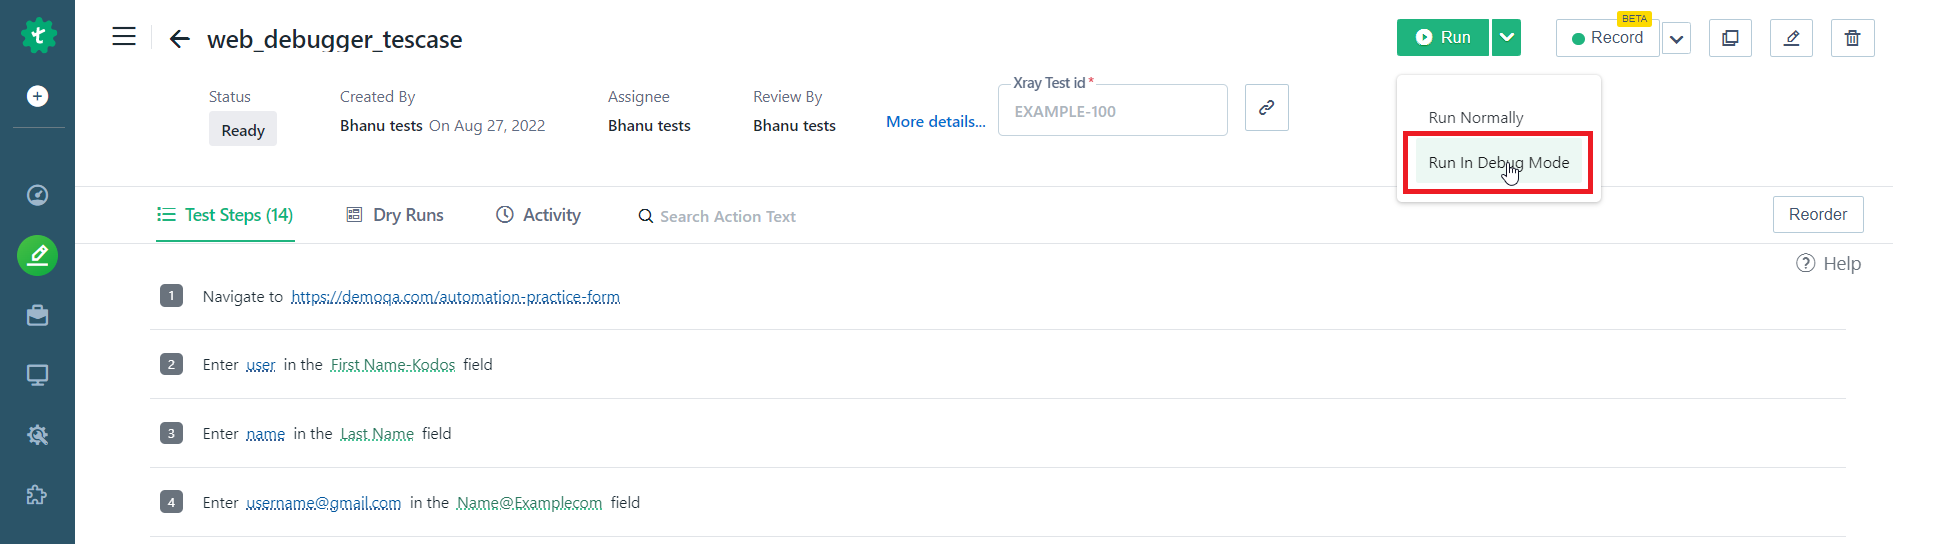
Optionally you can select Record in debug mode to capture screen shots during test execution for each UI-interactive action. Looking at the screen shots it is easier to identify where your test cases failed.
-
On the Ad-hoc run overlay window,
- Specify the test lab. The default test lab in debugging mode for web applications is Local Device.
- Select the checkbox Run only if the configured browser version is available in the Agent machine.
- Select your local test machine. To run tests on your local machine you need to set up a Testsigma agent. For more information, refer to set up Testsigma agent.
- If you want to execute the test steps until the failed step, select the toggle Run till failed step. If this toggle button is disabled, the test case will be executed from start to end. Thereby, identifying the test step that is failing would be difficult.
- If you want to execute the step till a particular step (that is setting a debug point), select the step from the Run till step drop-down list. For more information on debug points, refer to the section debug points.
- Click Run now to execute the test case.
Adding debug points to debug the test
Debug points are locations in your test steps where you want the test step to start or pause test case executions. This helps to observe the behavior of the test case. Multiple debug points can be added in a test case. Breaking up test execution this way ensures that you can carefully investigate each of the steps for potential bugs, instead of using a more inconvenient alternative. For example, letting the test case run at once and then trying to figure out in which step the things went wrong. To add debug points to your test case, follow the below steps:
- To add a debug point, click on the Show more icon next to the test step.
- Select Add debug point from the drop-down list. When the test case is executed, the execution is performed until the debug point. Multiple debug points can be added as and when desired.
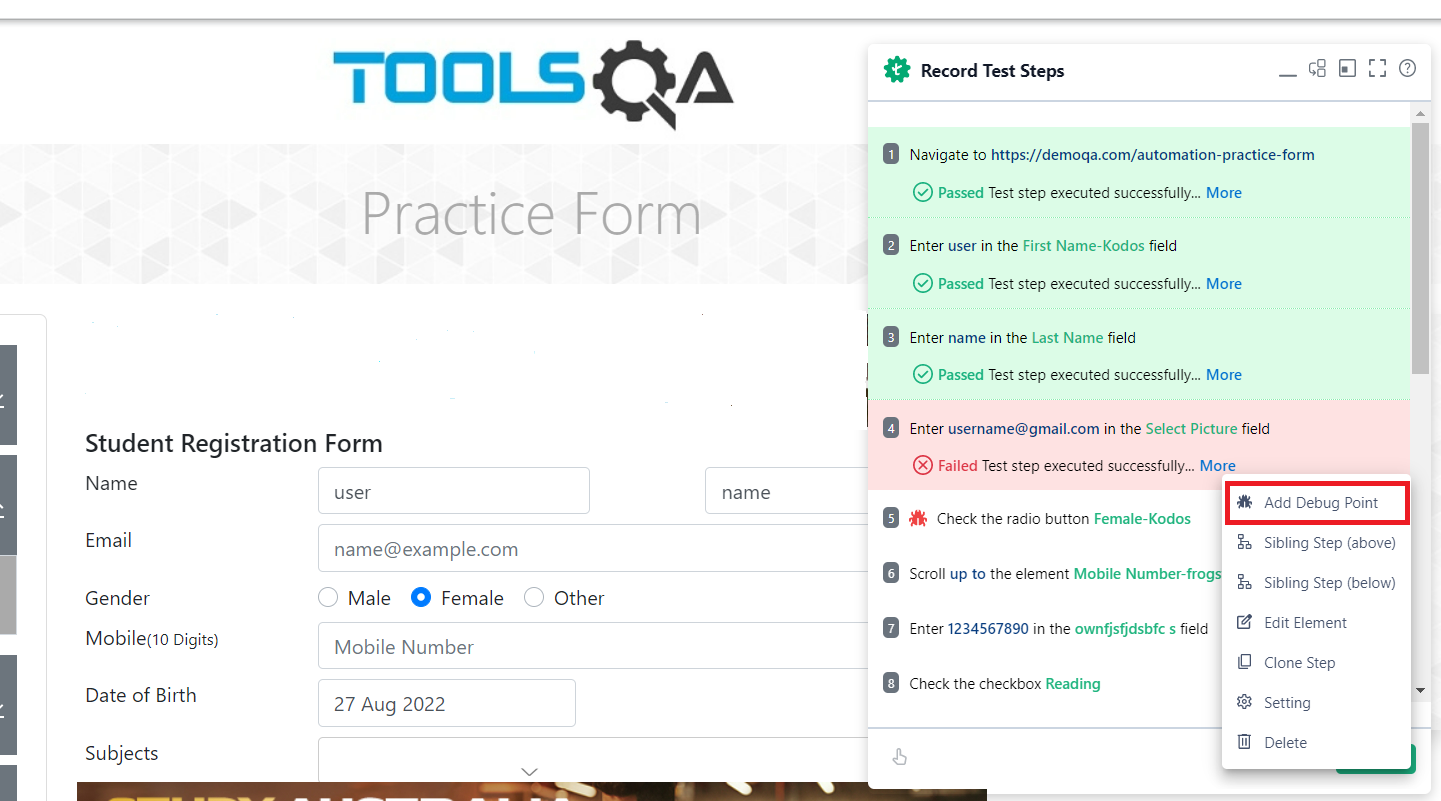
Fixing an error using debugging feature
On the execution of the test case, a user can visually view the execution move from step to step. Thus, it is easy to understand the execution workflow. The execution is paused when an error is encountered or at a debug point. On the test steps window, Testsigma highlights the step that failed and caused the execution to stop. With the execution paused, the debugging feature offers various resources to help you debug the error in the test step.
Debug resources
The debug resources provide a detailed and interactive analysis of the issue. The debugging resources include step results, metadata, screenshots, source codes, and step settings. These resources are available for all test steps including passed and failed test steps.
- To view the debugging resources, click More.
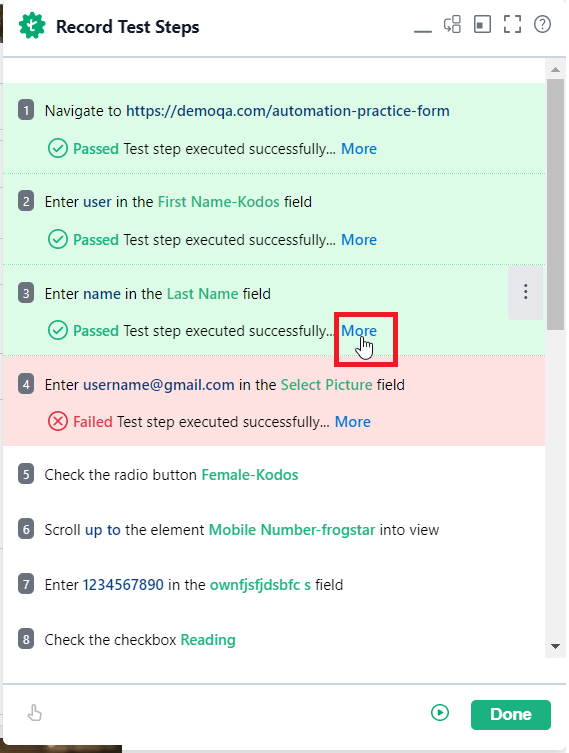
- Hover the mouse over each icon to find the details related to step results, metadata, screenshots, source codes, and step settings.
Troubleshoot ‘element not found error’
A common failure while executing test cases is that a particular element is not found during test execution. In some cases, the element is visibly available on the page but is still reported as not found by Testsigma. In such cases, follow the below steps to debug the error.
- Explore debug resources: To explore debug resources, click on More next to the failed step. The debug resources provide a detailed analysis of the issue.

- Check the UI element: To check the UI element which cannot be found, click Show more>Element search next to the test step. The relevant element is highlighted for 2 sec. You can compare the properties of the saved element with that of the element displayed on the screen.
-
Edit element: To edit an element, click on Show more>Edit step next to the failed step.
- Click on the saved element.
- You can add the element from the list of elements provided.
- Optionally, you can create a new element. To create an element, click on Create element.
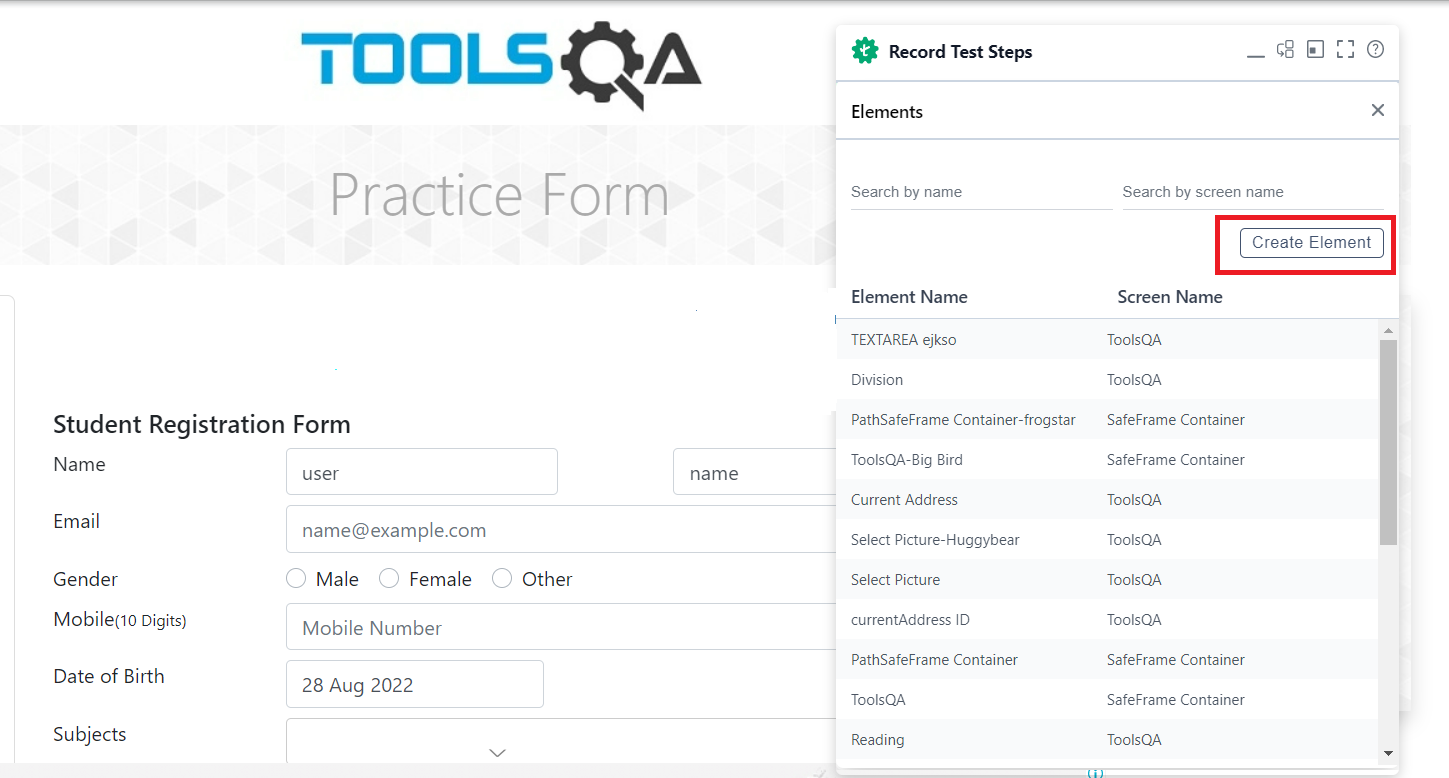
- Click on your desired element to automatically populate the element details field.
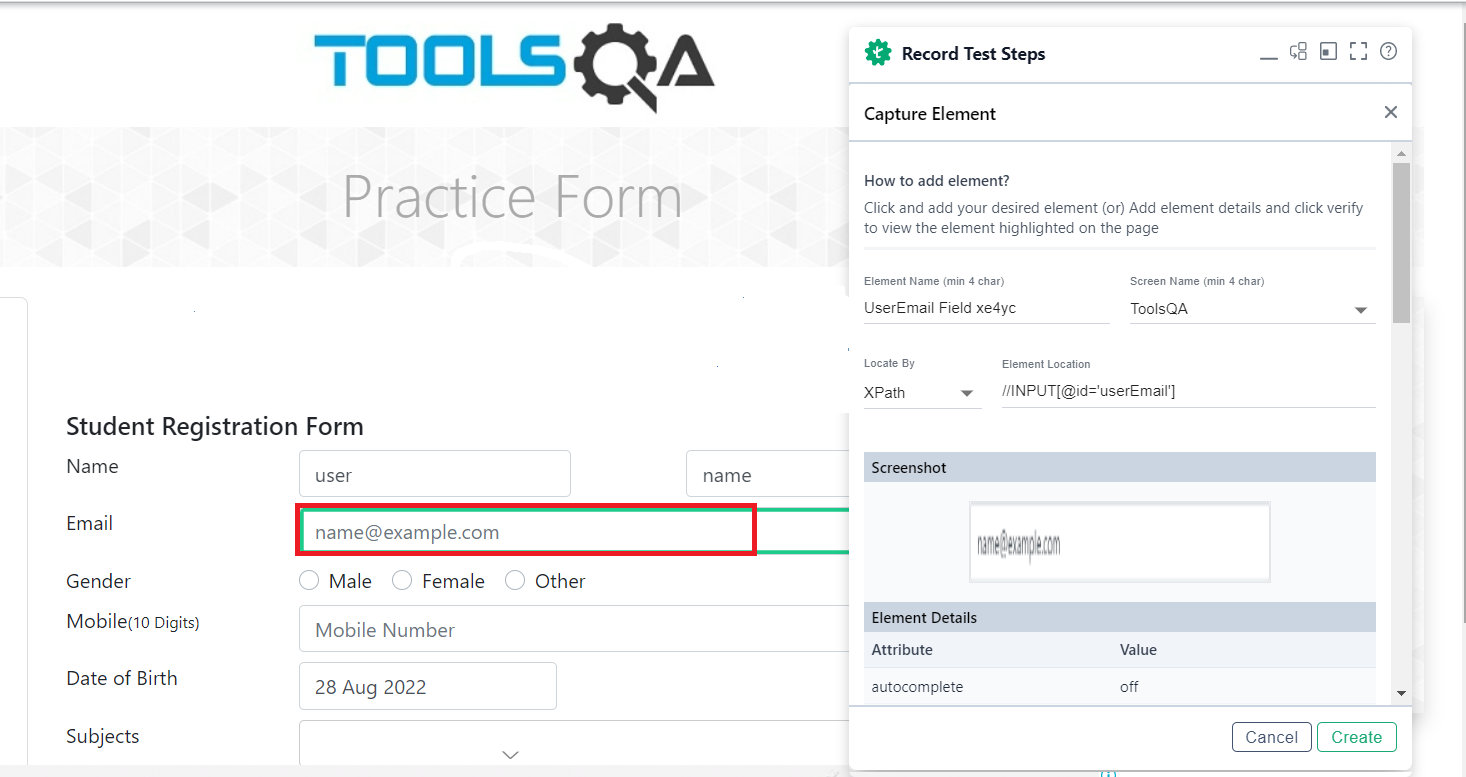
- Click Create.
- Optionally, you can add element details and click Verify to view the element highlighted on the page.
- Click Update, to update the test step.
- Test Execution: To re-execute, the test step after editing, click Show more > Re-run.
- To resume the execution of a test case from the previously paused test step, click Show more>Resume.